

Q Strong Anion Membrane Chromatography
1.Overview Ion exchange chromatography is a purification technique that separates biomolecules based on differences in their charge properties and charge quantity. Since most biological macromolecules contain carboxyl or hydroxyl groups, their charge characteristics and magnitude can be adjusted...
Product Introduction

1.Overview
Ion exchange chromatography is a purification technique that separates biomolecules based on differences in their charge properties and charge quantity. Since most biological macromolecules contain carboxyl or hydroxyl groups, their charge characteristics and magnitude can be adjusted by controlling the pH value of the buffer solution. After biomolecules bind to an oppositely charged anion or cation exchange medium, separation is achieved by changing the ionic strength or pH of the mobile phase, causing weakly bound molecules to elute first, followed by strongly bound molecules.
2. Product advantages
2.1 Fast and efficient - achieves high binding capacity at flow rates up to 40 times faster than traditional resins. Compared with packed-bed chromatography, the process time using membrane chromatography is reduced by 30–40 times. The typical operating flow rate is 10 MV/min.
2.2 High binding efficiency - membrane chromatography exhibits high loading capacity and high flow rates under low pressure drop conditions, allowing charged biomolecules to be captured in a single pass.
2.3 Scalable and flexible - the full series of membrane chromatography products can meet the diverse needs of biomacromolecule purification, covering all stages from process development to large-scale production. The capsule-type structural design supports both single-use operation and reuse after cleaning.
2.4 Improve productivity - The compact design minimizes facility footprint. By eliminating column packing, cleaning, cleaning validation, and column storage operations, the process requires less buffer for equilibration and can be performed directly without column preparation. Labor costs can be reduced by up to 50%.
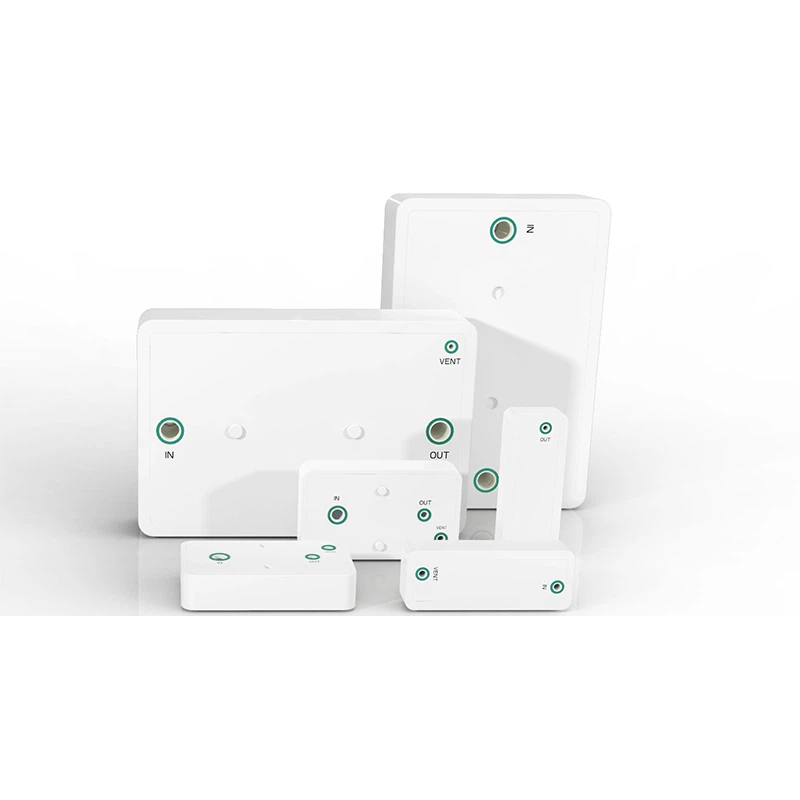
3. Technical parameter
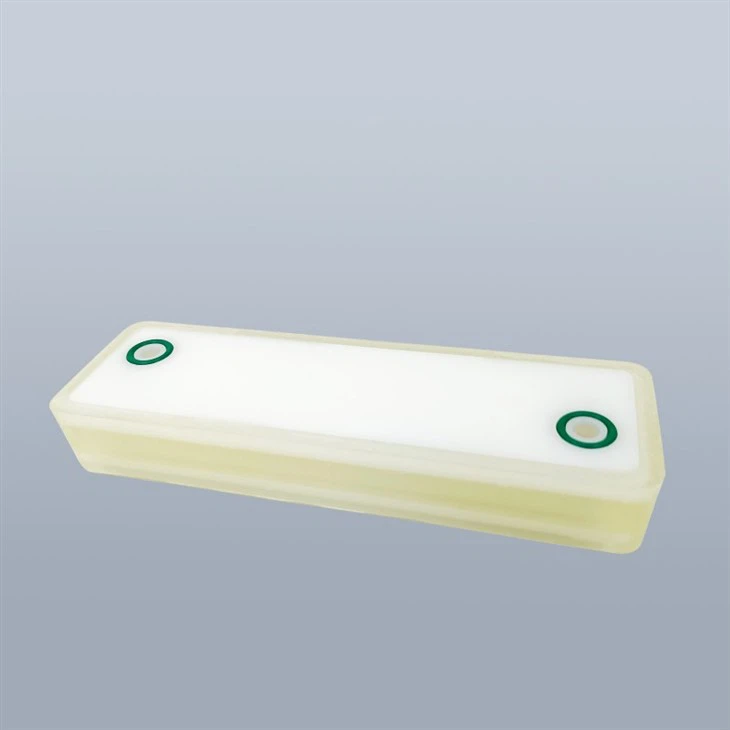
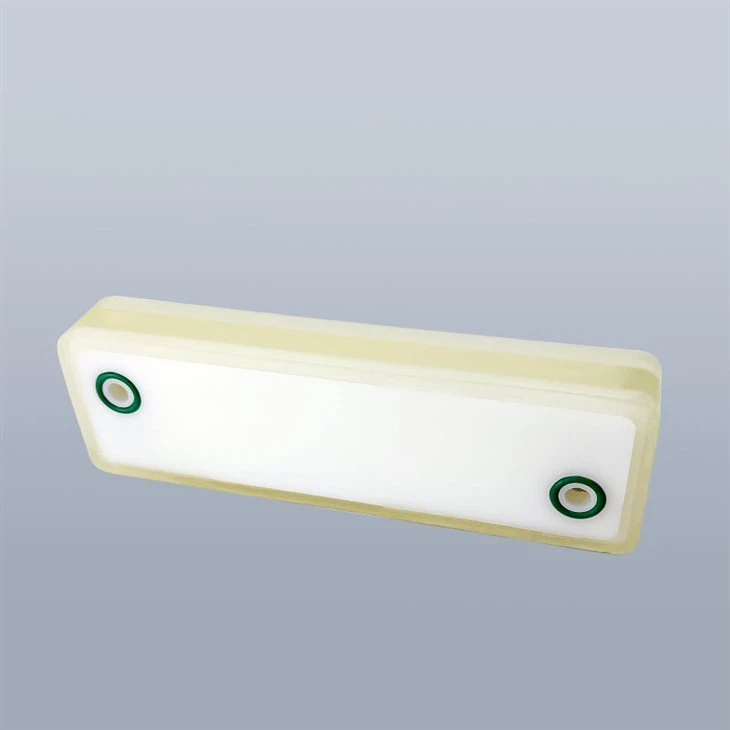
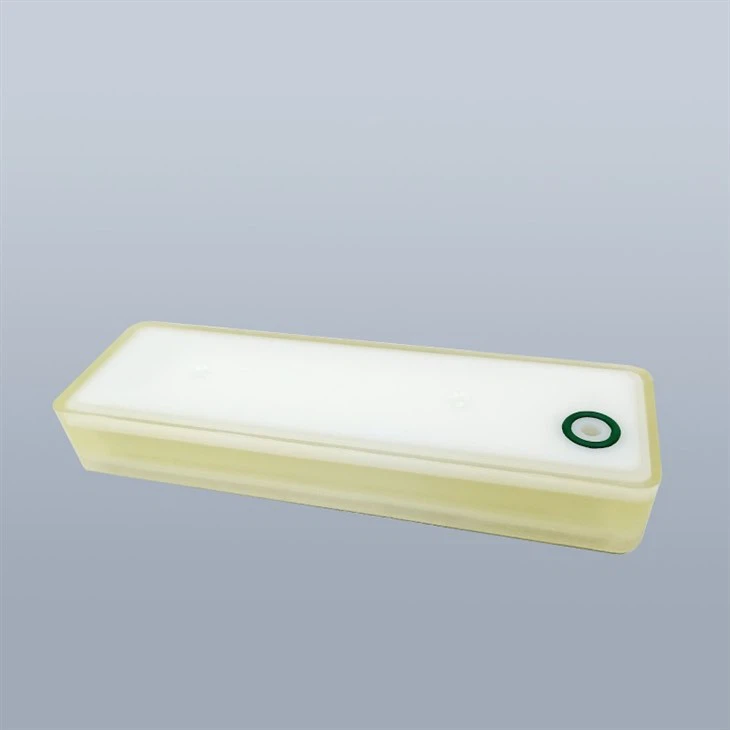
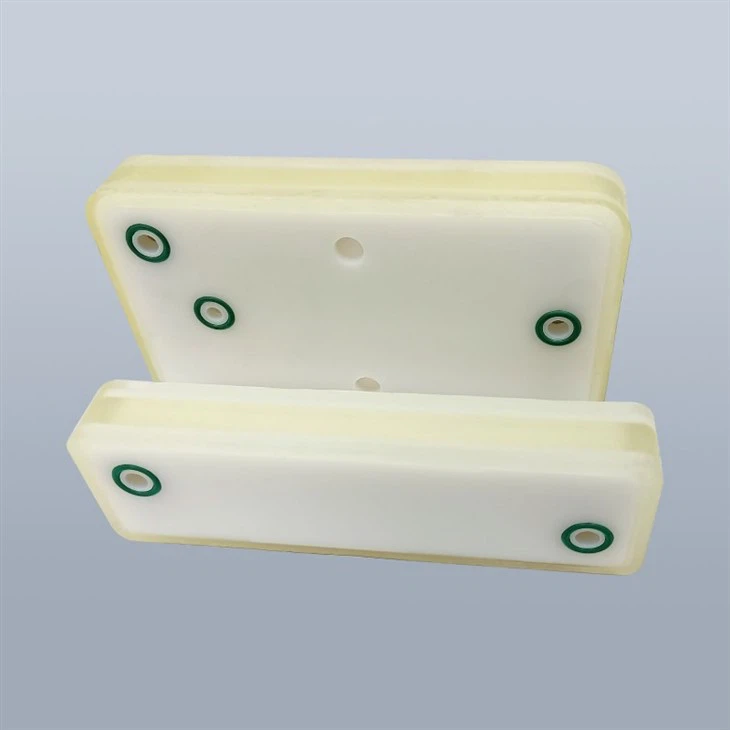
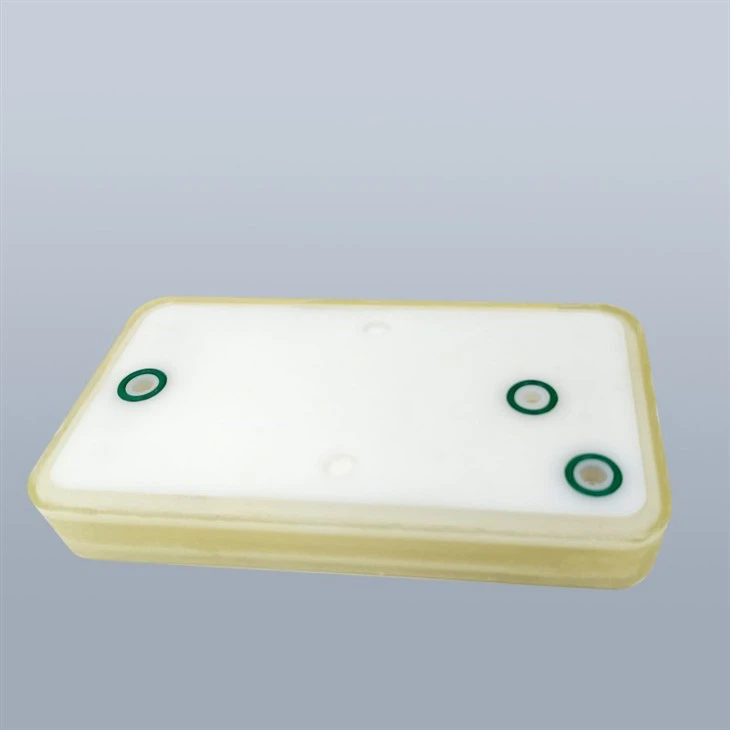
3.1 Structural material
|
Lab scale |
small scale |
pilot scale |
production scale |
|
|
membrane volume |
0.2ml |
5ml |
140ml |
5L |
|
Membrane support structure: |
polypropylene (PP) |
|||
|
membrane housing |
polypropylene (PP) |
|||
|
O ring |
silicone |
|||
3.2 Operating characteristics
|
Lab scale |
small scale |
pilot scale |
production scale |
|
|
membrane volume |
0.2ml |
5ml |
400ml |
5L |
|
Recommended flow rate |
1-6ml/min |
25-150ml/min |
2-12L/min |
25-150L/min |
|
Maximum operating temperature |
35℃ |
|||
|
Maximum operating pressure |
3bar(25℃) |
|||
|
Maximum pressure differential |
3bar(25℃) |
|||
|
Storage conditions: |
20% ethanol aqueous solution |
|||
The service life of Q membrane chromatography is comparable to that of agarose gel chromatography.


Figure 1. Changes in membrane chromatography loading capacity after multiple uses monitored by BSA
Additionally, we evaluated the removal efficiency of membrane chromatography for host cell proteins and nucleic acids. The results are as follows.
|
|
DNA |
HCP |
|||||
|
|
IgG Recovery |
Content(pg/mg of IgG)by RT PCR |
Removal Factor |
Content(ng/mg of IgG)by Elisa |
Removal Factor |
||
|
Run |
% |
Before Q Membrane |
After Q Membrane |
Log |
Before Q Membrane |
After Q Membrane |
Log |
|
1 |
96.7 |
423 |
1.2 |
2.55 |
7 |
4.8 |
0.16 |
|
2 |
97.4 |
438 |
1.3 |
2.53 |
7 |
4.9 |
0.15 |
|
3 |
94.7 |
513 |
1.3 |
2.60 |
6 |
1.9 |
0.50 |
|
4 |
95 |
32 |
0.9 |
1.55 |
6 |
4.2 |
0.15 |
|
5 |
96.3 |
45 |
1.1 |
1.61 |
8 |
5.2 |
0.19 |
|
6 |
96.5 |
158 |
0.7 |
2.35 |
8 |
6.2 |
0.11 |
|
7 |
96.4 |
267 |
1.9 |
2.15 |
9 |
7.2 |
0.10 |
|
8 |
96.8 |
298 |
2.3 |
2.11 |
9 |
8.2 |
0.04 |
|
9 |
97.1 |
746 |
1.5 |
2.70 |
4 |
2 |
0.30 |
|
10 |
96.6 |
39 |
1 |
1.59 |
4 |
1.5 |
0.43 |
Table 1. Removal rates of DNA and host cell proteins in CHO-expressed IgG material using Q membrane chromatography
A series of experiments demonstrated that Q membrane chromatography can effectively remove impurities while maintaining high target IgG recovery.
In addition, we compared Gudiling membrane chromatography with imported brands, and the loading capacity data are as follows:
|
Loading capacity(mg/ml) |
Sartorius |
PALL |
Guidling |
|
BSA |
29 |
60 |
45 |
|
SOD |
25 |
40 |
35 |
|
Protein A |
27 |
45 |
40 |
|
Trypsin |
30 |
56 |
44 |
Table 2. Loading performance of different proteins on our product and competitor products
Overall evaluation shows that our loading capacity is comparable to imported products,

Figure 2. Using a Q membrane chromatography module, BSA was used as the standard protein to evaluate the binding capacity. The dynamic binding capacity was compared with that of imported products. The results showed that most of the target protein could be captured and eluted with 150 mM NaCl when using BSA as the model protein.
Through different elution conditions, we found that the elution behavior of membrane chromatography is similar to that of agarose gel chromatography. The purity of proteins eluted at different salt concentrations varies significantly. In actual process development and production, it is necessary to quantitatively determine the optimal elution conditions in order to obtain the target protein with high purity.
4.Typical Application Case
Removal of DNA, viruses, host cell proteins (HCP), and endotoxins
Capture of plasmids, viruses, and proteins, as well as purification of oligonucleotides
5. Operating Procedure
5.1:Equipment Preparation and Assembly:
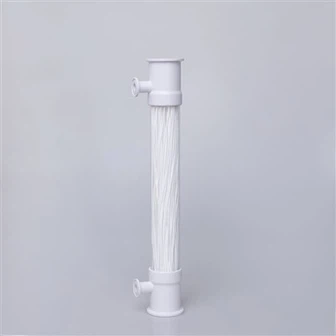
5.1.1:AKTA chromatography system: Install the membrane chromatography module in a manner similar to packed columns. Ensure that the arrow direction on the module is consistent with the feed flow direction. Connect the system using Luer connectors or Tri-Clamp fittings.
5.1.2 Set the inlet flow rate to 5–10 MV/min and use the equilibration buffer to remove air from the system. After ensuring that there are no air bubbles in the outlet stream, connect the permeate outlet to the chromatography system.
5.2:Pre-use Treatment:
5.2.1:
Set the inlet flow rate to 5–10 MV/min and perform pre-treatment with 0.5 M NaOH at >5 MV to ensure the membrane reaches equilibrium.
5.2.2:
At the same flow rate, perform pre-treatment with 1 M NaCl at >5 MV to ensure the membrane reaches equilibrium.
5.3 Chromatography Process
5.3.1 Set the feed flow rate to 5–10 MV/min and perform pre-treatment with equilibration buffer at >5 MV until the membrane reaches equilibrium.
5.3.2 After the sample is pre-filtered through a 0.22 μm filter, load it onto the column until the entire sample is applied or the chromatography binding capacity is reached.
5.3.3 Flush with equilibration buffer at >10 MV until the UV signal drops to the baseline.
5.3.4 Perform gradient or linear elution according to the designed protocol, and collect fractions as needed.
5.4 CIP Post-use Treatment – Membrane Chromatography Device CIP
5.4.1 Set the feed flow rate to 5–10 MV/min and treat with 1 M NaOH at >10 MV until the UV signal drops below the baseline.
5.4.2 After circulating for 30 minutes, switch to water wash until the pH reaches 7–8, then switch to 20% ethanol and continue washing until the conductivity stabilizes.
5.5,Membrane Chromatography Storage:
After use and completion of CIP, the membrane module can be disassembled and stored in 20% ethanol, or kept online at room temperature in 20% ethanol. The ethanol solution should be periodically replaced and inspected.
6. Ordering Information
Q Strong Anion-Exchange Membrane Chromatography Capsule Filter
|
Lab scale |
small scale |
pilot scale |
production scale |
|
|
Product Model |
IEXQ0002ES |
IEXQ0050ES |
IEXQ0400ES |
IEXQ5000ES |
|
membrane volume |
0.2ml |
5ml |
400ml |
5L |
Hot Tags: q strong anion membrane chromatography, China, suppliers, manufacturers, factory, wholesale, bulk, in stock, free sample
You Might Also Like


Send Inquiry